Gender Over Time
Having made some interesting discoveries when exploring our data, we are ready to look at the evolution over time of gender in new characters.
We will make a plot to show how many new characters were female in each year. Since the number of new characters changes over time, we will display the percentage of a publisher's new characters for a year who are female.
plot_percentages(all_comics, "Year", "Publisher", "Gender", "Female")
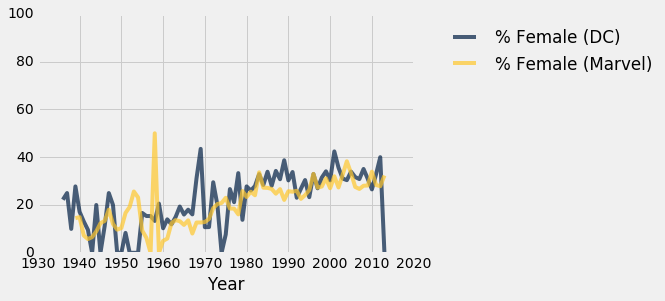
It is hard to interpret this plot because it jumps around so much. Plotting the total number of new characters per year will show us why:
all_comics.pivot("Publisher", "Year").plot("Year")
plots.title("Number of new characters in each year");
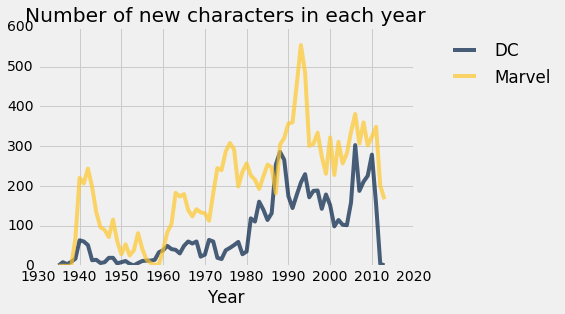
Some years had very few new characters, particularly the 1950s, when comic books were in a period of decline. Also, it looks like the data for the most recent year (2013) are incomplete. When a percentage is computed from a small number of individuals, it can vary wildly. For example, in a year with only 2 new character, we wouldn't be too surprised to see 0 (0%) or 2 (100%) of them female. Averaging our results over a few years will eliminate some of the "wiggling" in our earlier plot and make the trend clearer.
before_2013 = all_comics.where("Year", are.below(2013))
rounded_years = round_to_nearest(before_2013.column("Year"), 5)

plot_percentages(
    before_2013.with_column("Year", rounded_years),
    "Year", "Publisher", "Gender", "Female")
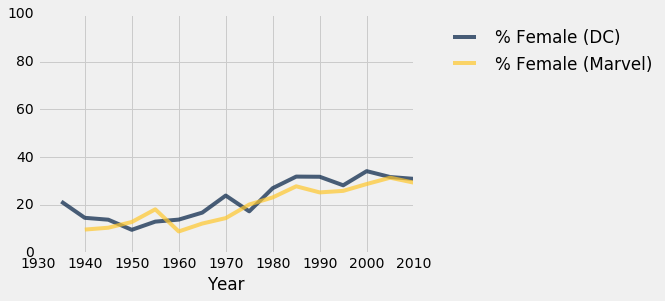
It appears that both DC and Marvel have been introducing more female characters over time (as a percentage of all new characters), but still only around 30% of new characters are female.