Explorations
We will examine how the gender balance among characters evolved over time. Before using a dataset to answer any complicated question, it's important to do more basic explorations to understand what's in the dataset. Let's first look at the number of new characters overall.
print("There were {:d} Marvel characters and {:d} DC characters.".format(
                  marvel.num_rows,           dc.num_rows))
Instead of printing out these numbers, we can make a bar chart:
all_comics = marvel.copy().append(dc)
all_comics.group_barh("Publisher", width=8)
plots.title("Number of comic book characters created by Marvel and DC");
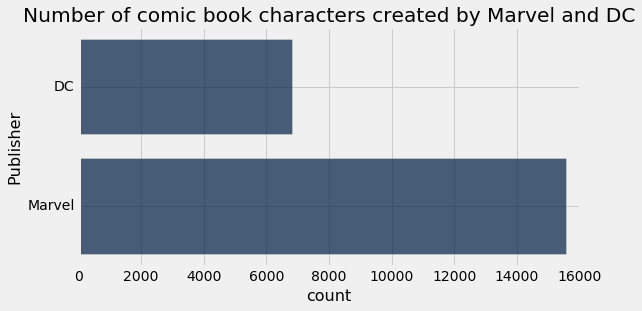
The bar chart conveys the same information in a picture rather than text. That is, Marvel has created more than twice as many characters (a bit less than 16000) as DC has (a bit less than 7000).
Notice that your brain understands the ratio of DC characters to Marvel characters from the bar chart, apparently without any conscious arithmetic. This is a small example of the power of visual representations of data.
Now let us check the overall balance of genders. First, we'll look at that information in another table.
all_comics.group("Gender")
Again, a bar chart is easier to read:
all_comics.group_barh("Gender", width=7)
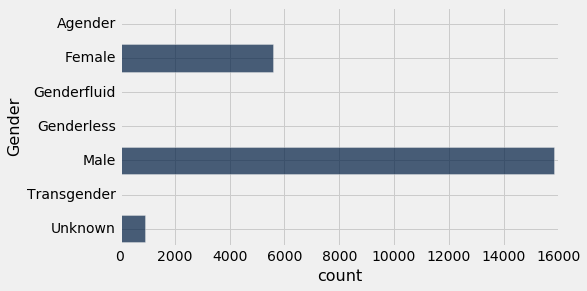
There are more than twice as many male characters as female characters.
Visualization becomes more critical for comprehension as information becomes richer. To compare gender representation in DC and Marvel, we could make a table similar to the one above:
all_comics.pivot("Publisher", "Gender")
However, a bar chart is more natural for comparing the larger categories:
all_comics.pivot("Publisher", "Gender").barh("Gender")
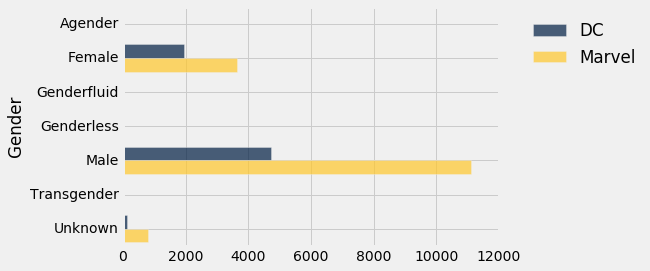
Marvel has many more female characters, but DC has fewer characters overall. If we want to know the representation of each gender, we should look at the numbers as a proportion of all characters from each publisher. For example, the the percentage of Marvel characters who are female is:
$$\frac{ \text{Number of Marvel characters who are female} } { \text{Number of Marvel characters} } \times 100\%$$Looking at percentages rather than raw numbers is called normalizing the data. The code below looks a little complicated, but it simply implements that formula for each publisher and gender and then creates a bar chart displaying the percentages. (Don't be concerned - you don't need to be able to read this code yet!)
gender_by_publisher = all_comics.pivot("Publisher", "Gender")
dc_percent = 100*gender_by_publisher.column("DC")\
             / sum(gender_by_publisher.column("DC"))
marvel_percent = 100*gender_by_publisher.column("Marvel")\
                 / sum(gender_by_publisher.column("Marvel"))
gender_by_publisher.with_column("DC", dc_percent)\
                   .with_column("Marvel", marvel_percent)\
                   .barh("Gender")
plots.title("Percentage of genders among new characters, by publisher");
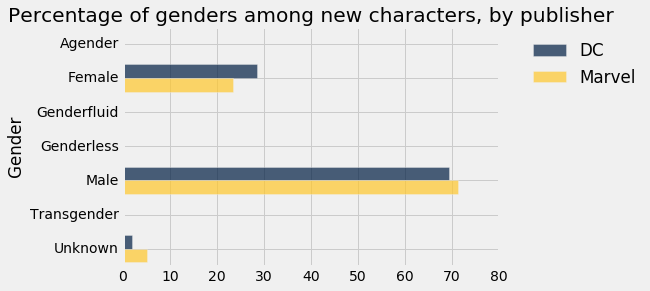
DC actually has more female characters than Marvel does, as a percentage of all its characters. But both percentages are below 30%. In the unnormalized chart, it was hard to tell which publisher had a higher rate of female characters, since DC had fewer characters overall. Normalizing the data was important, and it will be important in considering our main question about change over time.
Finally, the representation of people in comic books depends not just on the number of characters but also on the role and prevalence of characters. This dataset has some coarse information about how characters are portrayed - as villains or heroes, for example - and the number of times characters appeared. Let us count how many times characters of each gender appeared. This time, we will normalize by the total number of appearances:
$$\text{Percentage of appearances by female characters in DC comics} = \frac{ \text{ Number of appearances by female characters in DC comics } } { \text{ Number of character appearances in DC comics } } \times 100\%$$Again, the code looks complicated, but it simply implements that formula for each publisher and gender.
appearances = all_comics.pivot("Publisher", "Gender", "Appearances", sum)
dc_appearances = 100*appearances.column("DC")\
                 / sum(appearances.column("DC"))
marvel_appearances = 100*appearances.column("Marvel")\
                     / sum(appearances.column("Marvel"))
appearances.with_column("DC", dc_appearances)\
           .with_column("Marvel", marvel_appearances)\
           .barh("Gender")
plots.title("Percentage of character appearances for each gender, by publisher");
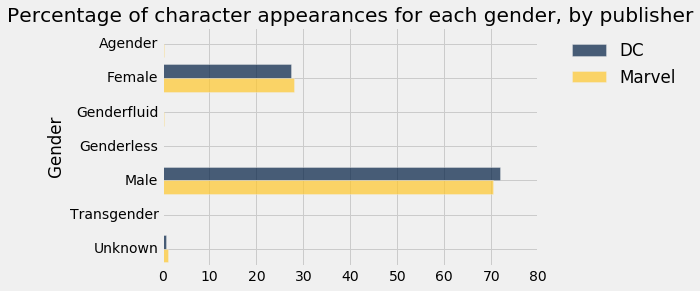
Comparing this chart to the previous one, we see that appearance rates don't seem to make much difference. For simplicity, we will ignore them.
Before we finish our exploration, we should notice an important problem with the bar chart visualizations: the rarer categories are so small that their bars appear empty. In some ways this is accurate, since there have been vanishingly few transgender or agender characters in comic books. But the tables show that the numbers are not 0; there are 36 agender Marvel characters and 20 genderless DC characters. (In fact, this also suggests that Marvel uses the term "agender" for characters who have no gender, while DC uses "genderless." An analysis of representation of agender people would probably need to group those two categories together.)